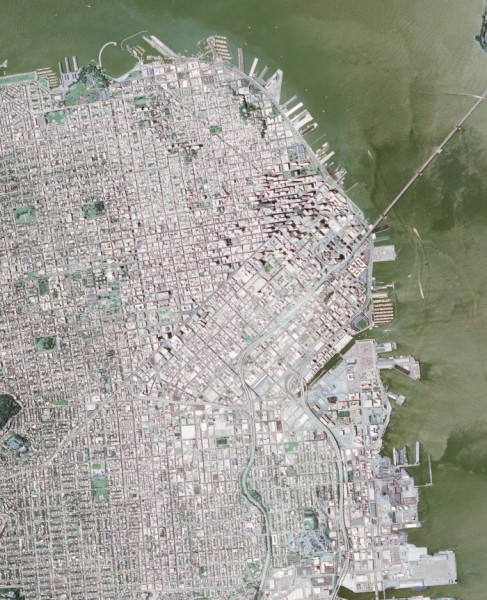
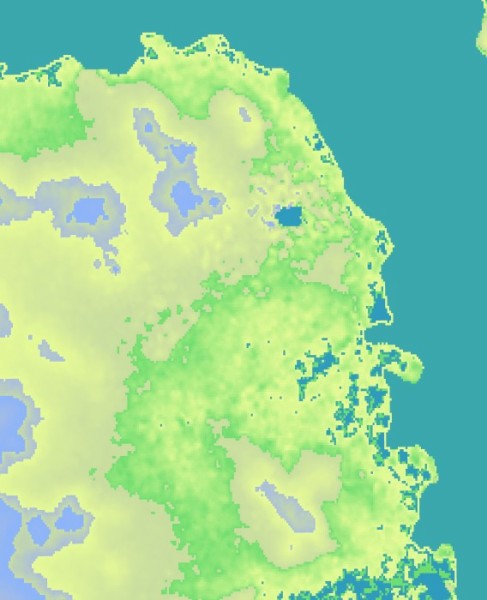
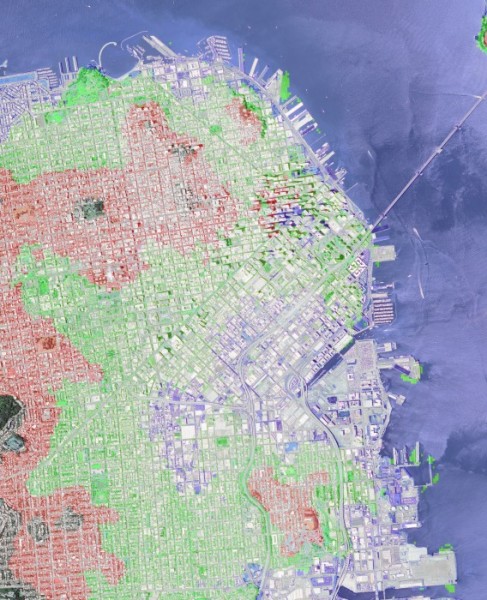
為實現這些目標,以下程式碼將數字高程模型以及舊金山的GeoTiff影像作為輸入。影像和DEM資料經過處理後,生成影像的地形熱力圖,並標註出海灣水位上升10米、50米和100米時會受影響的城市區域。
#include <cmath>
#include <iostream>
#include <stdexcept>
#include <vector>
std::vector<std::pair<cv::Vec3b,double> > color_range;
((1-t)*p1.
y) + (t*p2.
y));
}
template <typename DATATYPE, int N>
double const& t ){
for( int i=0; i<N; i++ ){
output[i] = (
uchar)(((1-t)*minColor[i]) + (t * maxColor[i]));
}
return output;
}
cv::Vec3b get_dem_color(
const double& elevation ){
if( elevation < color_range[0].second ){
return color_range[0].first;
}
if( elevation > color_range.back().second ){
return color_range.back().first;
}
int idx=0;
double t = 0;
for( int x=0; x<(int)(color_range.size()-1); x++ ){
if( elevation < color_range[x+1].second ){
idx=x;
t = (color_range[x+1].second - elevation)/
(color_range[x+1].second - color_range[x].second);
break;
}
}
return lerp( color_range[idx].first, color_range[idx+1].first, t);
}
double demRatioX = ((dem_tr.x - coordinate.
x)/(dem_tr.x - dem_bl.x));
double demRatioY = 1-((dem_tr.y - coordinate.
y)/(dem_tr.y - dem_bl.y));
output.
x = demRatioX * dem_size.
width;
output.
y = demRatioY * dem_size.
height;
return output;
}
double rx = (double)x /
size.width;
double ry = (double)y /
size.height;
return lerp( leftSide, rightSide, rx );
}
if( pix[0] + b < 255 && pix[0] + b >= 0 ){ pix[0] += b; }
if( pix[1] + g < 255 && pix[1] + g >= 0 ){ pix[1] += g; }
if( pix[2] + r < 255 && pix[2] + r >= 0 ){ pix[2] += r; }
}
int main(
int argc,
char* argv[] ){
if( argc < 3 ){
cout << "usage: " << argv[0] << " <image_name> <dem_model_name>" << endl;
return -1;
}
if( dem.
type() !=
CV_16SC1 ){
throw std::runtime_error(
"DEM image type must be CV_16SC1"); }
color_range.push_back( std::pair<cv::Vec3b,double>(
cv::Vec3b( 188, 154, 46), -1));
color_range.push_back( std::pair<cv::Vec3b,double>(
cv::Vec3b( 110, 220, 110), 0.25));
color_range.push_back( std::pair<cv::Vec3b,double>(
cv::Vec3b( 150, 250, 230), 20));
color_range.push_back( std::pair<cv::Vec3b,double>(
cv::Vec3b( 160, 220, 200), 75));
color_range.push_back( std::pair<cv::Vec3b,double>(
cv::Vec3b( 220, 190, 170), 100));
color_range.push_back( std::pair<cv::Vec3b,double>(
cv::Vec3b( 250, 180, 140), 200));
double minElevation = -10;
for(
int y=0; y<image.
rows; y++ ){
for(
int x=0; x<image.
cols; x++ ){
double dz;
if( dem_coordinate.
x >= 0 && dem_coordinate.
y >= 0 &&
dem_coordinate.
x < dem.
cols && dem_coordinate.
y < dem.
rows ){
dz = dem.
at<
short>(dem_coordinate);
}else{
dz = minElevation;
}
if( dz < 10 ){
add_color( output_dem_flood.at<
cv::Vec3b>(y,x), 90, 0, 0 );
}
else if( dz < 50 ){
add_color( output_dem_flood.at<
cv::Vec3b>(y,x), 0, 90, 0 );
}
else if( dz < 100 ){
add_color( output_dem_flood.at<
cv::Vec3b>(y,x), 0, 0, 90 );
}
}}
return 0;
}
MatSize size
定義 mat.hpp:2187
_Tp & at(int i0=0)
返回指定陣列元素的引用。
int rows
當矩陣維度超過2時,為行數和列數,或(-1, -1)
定義 mat.hpp:2165
int type() const
返回矩陣元素的型別。
_Tp y
點的 y 座標
定義 types.hpp:202
_Tp x
點的 x 座標
定義 types.hpp:201
用於指定影像或矩形大小的模板類。
Definition types.hpp:335
_Tp height
高度
Definition types.hpp:363
_Tp width
寬度
Definition types.hpp:362
用於短數值向量的模板類,是Matx的一個特例。
定義 matx.hpp:369
Point_< double > Point2d
定義 types.hpp:208
#define CV_16SC1
定義 interface.h:106
@ IMREAD_ANYDEPTH
如果設定,當輸入具有相應的深度時返回16位/32點陣圖像,否則將其轉換為...
定義 imgcodecs.hpp:74
@ IMREAD_LOAD_GDAL
如果設定,使用 GDAL 驅動程式載入影像。
定義 imgcodecs.hpp:76
@ IMREAD_COLOR
與 IMREAD_COLOR_BGR 相同。
定義 imgcodecs.hpp:73
CV_EXPORTS_W bool imwrite(const String &filename, InputArray img, const std::vector< int > ¶ms=std::vector< int >())
將影像儲存到指定檔案。
CV_EXPORTS_W Mat imread(const String &filename, int flags=IMREAD_COLOR_BGR)
從檔案載入影像。
int main(int argc, char *argv[])
定義 highgui_qt.cpp:3
GOpaque< Size > size(const GMat &src)
從 Mat 獲取維度。
載入數字高程模型時,每個畫素的實際數值至關重要,不能進行縮放或截斷。例如,在影像資料中,一個值為1的雙精度畫素與一個值為255的無符號字元畫素在外觀上是相同的。而對於地形資料,畫素值代表以米為單位的高程。為了確保OpenCV保留原始值,請在imread中使用GDAL標誌並結合ANYDEPTH標誌。
如果您事先知道正在載入的DEM模型型別,那麼使用斷言或其他機制測試 Mat::type() 或 Mat::depth() 可能是穩妥的做法。NASA或DOD規範文件可以提供各種高程模型的輸入型別。主要型別,SRTM和DTED,都是帶符號的短整型。
地理座標系是球形座標系,這意味著將其與笛卡爾數學結合使用在技術上是不正確的。本演示使用它們是為了提高可讀性,並且其精度足以說明問題。更好的座標系將是通用橫軸墨卡託(Universal Transverse Mercator)。
\f$> gdalinfo N37W123.hgt
Driver: SRTMHGT/SRTMHGT File Format
Files: N37W123.hgt
Size is 3601, 3601
Coordinate System is
GEOGCS["WGS 84",
DATUM["WGS_1984",
... more output ...
Corner Coordinates
Upper Left (-123.0001389, 38.0001389) (123d 0' 0.50"W, 38d 0' 0.50"N)
Lower Left (-123.0001389, 36.9998611) (123d 0' 0.50"W, 36d59'59.50"N)
Upper Right (-121.9998611, 38.0001389) (121d59'59.50"W, 38d 0' 0.50"N)
Lower Right (-121.9998611, 36.9998611) (121d59'59.50"W, 36d59'59.50"N)
Center (-122.5000000, 37.5000000) (122d30' 0.00"W, 37d30' 0.00"N)
... more output ...